
Southern Maryland Housing Market Update — October 2026
More homes on the market, fewer closings and a regional median sold price that barely moved—here’s how Calvert, St. Mary’s and Charles Counties compared with last October.
- Data
- Bright MLS Market Statistics Report
- Period
- October 2026 compared with October 2025
- Coverage
- Calvert, St. Mary’s and Charles Counties · residential, countywide
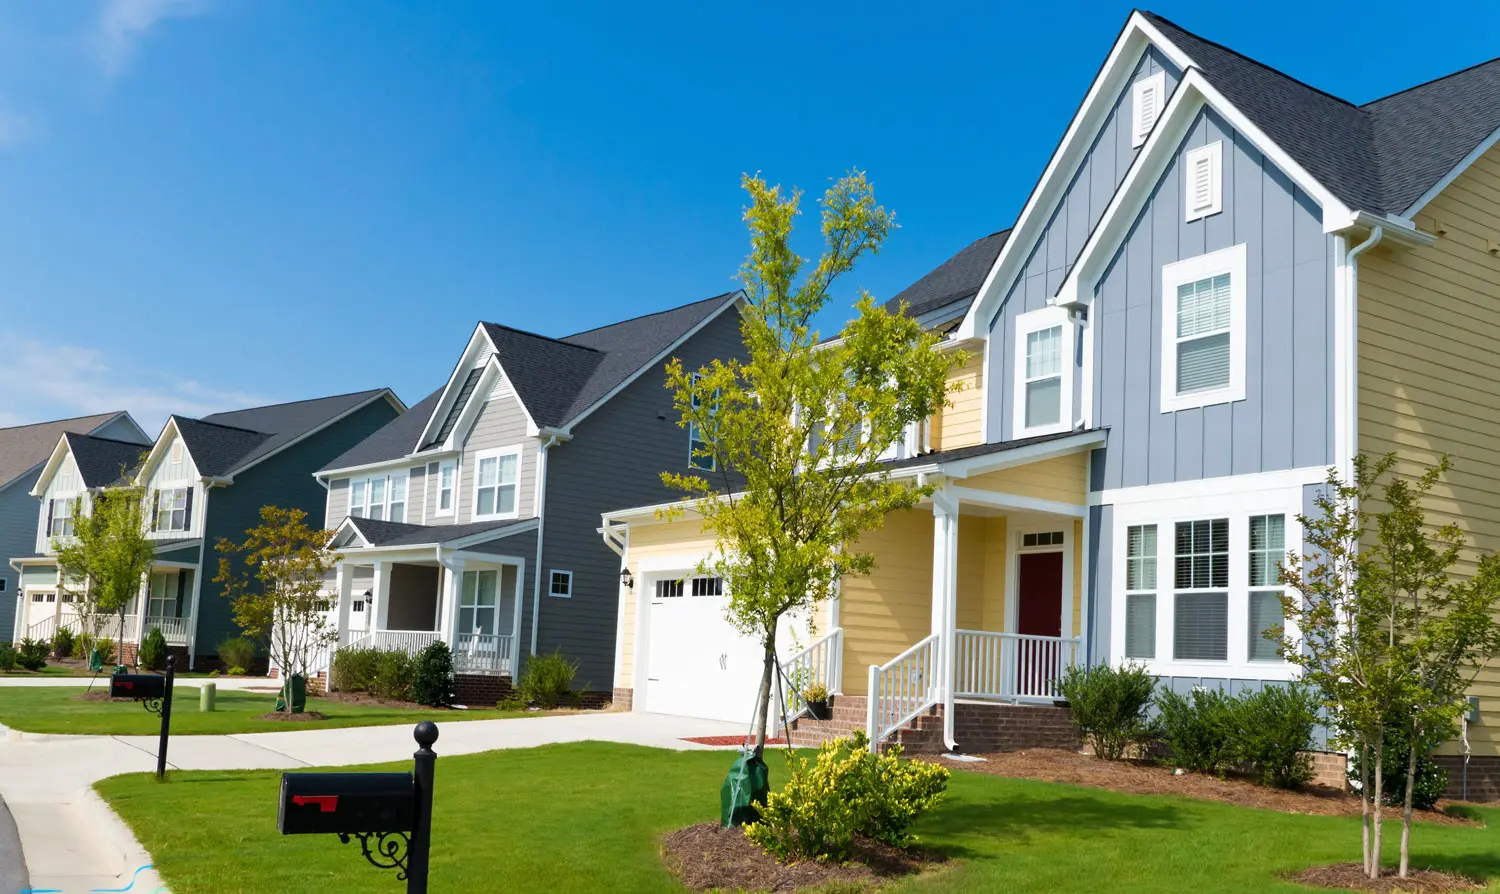
Southern Maryland entered the fall market with more available homes, fewer closed sales and a regional median sold price that remained nearly unchanged compared with October 2025.
Across Calvert, St. Mary’s and Charles Counties combined, there were 1,571 active homes at the end of October 2026, compared with 1,306 a year earlier—an increase of 20.3%.
Over the same period, closed sales fell from 437 to 347, a decline of 20.6%.
Yet the regional median sold price was $449,900, compared with $450,000 last October—essentially unchanged.
Inventory increased in all three counties. Closed sales declined in all three counties. But prices told three different stories: the median sold price rose in Charles County, eased in St. Mary’s County and fell more sharply in Calvert County, where a high comparison month from last year deserves a closer look.
Buyers have more to choose from than they did a year ago. That’s a meaningful shift—but it isn’t the same thing as falling prices across the board.
Southern Maryland at a Glance
| October 2026 | Calvert County | St. Mary’s County | Charles County |
|---|---|---|---|
| New listings | 173 | 144 | 313 |
| Active inventory | 410 | 335 | 826 |
| Closed sales | 86 | 100 | 161 |
| Median sold price | $450,000 | $428,700 | $450,000 |
| Days on market (DOM) | 35 | 40 | 48 |
| Cumulative days on market (CDOM) | 42 | 47 | 64 |
| Months of supply | 3.9 | 3.6 | 4.3 |
Source: Bright MLS Market Statistics Report, October 2026. Residential properties, countywide.
| Metric | Oct. 2026 | Oct. 2025 | Change |
|---|---|---|---|
| New listings | 630 | 609 | +21 (+3.4%) |
| Active inventory | 1,571 | 1,306 | +265 (+20.3%) |
| Closed sales | 347 | 437 | −90 (−20.6%) |
| Median sold price | $449,900 | $450,000 | −$100 (essentially unchanged) |
| DOM | 43 | 40 | +3 days (+7.5%) |
| CDOM | 54 | 52 | +2 days (+3.8%) |
| Months of supply | 4.0 | 3.2 | +0.8 months |
Source: Bright MLS Market Statistics Report for Calvert, St. Mary’s and Charles Counties run as a single combined report, October 2025 and October 2026. The regional median sold price comes from that combined report—it is not an average of the three county medians.
Calvert County: The Biggest Jump in Inventory—and a Median Worth Reading Carefully
Oct. 2025 → Oct. 2026- Active inventory410from 290+41.4%
- Closed sales86from 108−20.4%
- Median sold price$450,000from $521,500−13.7%
- DOM35from 39−4 days
Calvert County saw the largest increase in available homes among the three Southern Maryland counties.
There were 410 active homes at the end of October 2026, compared with 290 one year earlier—an increase of 41.4%.
New listings also climbed, from 139 to 173, up 24.5%.
Closed sales moved in the opposite direction, declining from 108 to 86, down 20.4%.
Months of supply increased from 3.3 to 3.9 months.
The median sold price is the number that needs the most context.
Calvert County’s median sold price was $450,000 in October 2026, compared with $521,500 in October 2025—a difference of $71,500, or 13.7%.
That October 2025 figure stands out. In the same Bright MLS countywide report, it was the highest monthly Calvert County median from August through December 2025—well above the $475,000 recorded in September 2025 and the $479,900 recorded in November 2025. This October’s figure is also based on just 86 closed sales.
A median sold price reflects the mix of homes that happened to close in a given month—their size, location, condition and price range. When a comparison month includes an unusual mix of higher-priced sales, the year-over-year change can look larger than the underlying trend.
So while the October median was lower, it would be a mistake to read that as every Calvert County home losing 13.7% of its value.
Homes that sold also didn’t take longer to do so. DOM decreased from 39 to 35 days, and CDOM moved from 44 to 42 days.
| Metric | Oct. 2026 | Oct. 2025 | Change |
|---|---|---|---|
| New listings | 173 | 139 | +34 (+24.5%) |
| Active inventory | 410 | 290 | +120 (+41.4%) |
| Closed sales | 86 | 108 | −22 (−20.4%) |
| Median sold price | $450,000 | $521,500 | −$71,500 (−13.7%) |
| DOM | 35 | 39 | −4 days (−10.3%) |
| CDOM | 42 | 44 | −2 days (−4.5%) |
| Months of supply | 3.9 | 3.3 | +0.6 months |

What this means for Calvert County sellers
Sellers are competing against substantially more homes than they were a year ago, with fewer buyers closing each month.
That makes the first impression—price, condition, photography and positioning—more important. It also makes it more important to price against today’s competing listings and recent comparable sales, rather than a countywide headline in either direction.
What this means for Calvert County buyers
More inventory means more homes to compare and, in many cases, less pressure to decide quickly.
Homes that sold in October still did so in a similar amount of time as last year, so well-priced, well-presented properties may continue to attract attention. The opportunity is in having more options—not in assuming every seller will discount.
St. Mary’s County: Fewer Sales and the Largest Rise in Months of Supply
Oct. 2025 → Oct. 2026- Active inventory335from 284+18.0%
- Closed sales100from 135−25.9%
- Median sold price$428,700from $450,000−4.7%
- DOM40from 38+2 days
In St. Mary’s County, new listings were essentially unchanged: 144 this October versus 142 last October.
Inventory still increased, from 284 active homes to 335—up 18.0%.
The bigger change was in closed sales, which fell from 135 to 100, a decline of 25.9%. That was the largest percentage decline in closed sales among the three counties.
With new listings roughly flat and fewer homes closing, months of supply increased from 2.2 to 3.6 months—the largest increase in the region.
Even so, 3.6 months of supply is still a moderate level of inventory.
The median sold price was $428,700, compared with $450,000 in October 2025—a difference of $21,300, or 4.7%.
Marketing time sent mixed signals. DOM increased from 38 to 40 days, while CDOM decreased from 49 to 47 days.
| Metric | Oct. 2026 | Oct. 2025 | Change |
|---|---|---|---|
| New listings | 144 | 142 | +2 (+1.4%) |
| Active inventory | 335 | 284 | +51 (+18.0%) |
| Closed sales | 100 | 135 | −35 (−25.9%) |
| Median sold price | $428,700 | $450,000 | −$21,300 (−4.7%) |
| DOM | 40 | 38 | +2 days (+5.3%) |
| CDOM | 47 | 49 | −2 days (−4.1%) |
| Months of supply | 3.6 | 2.2 | +1.4 months |
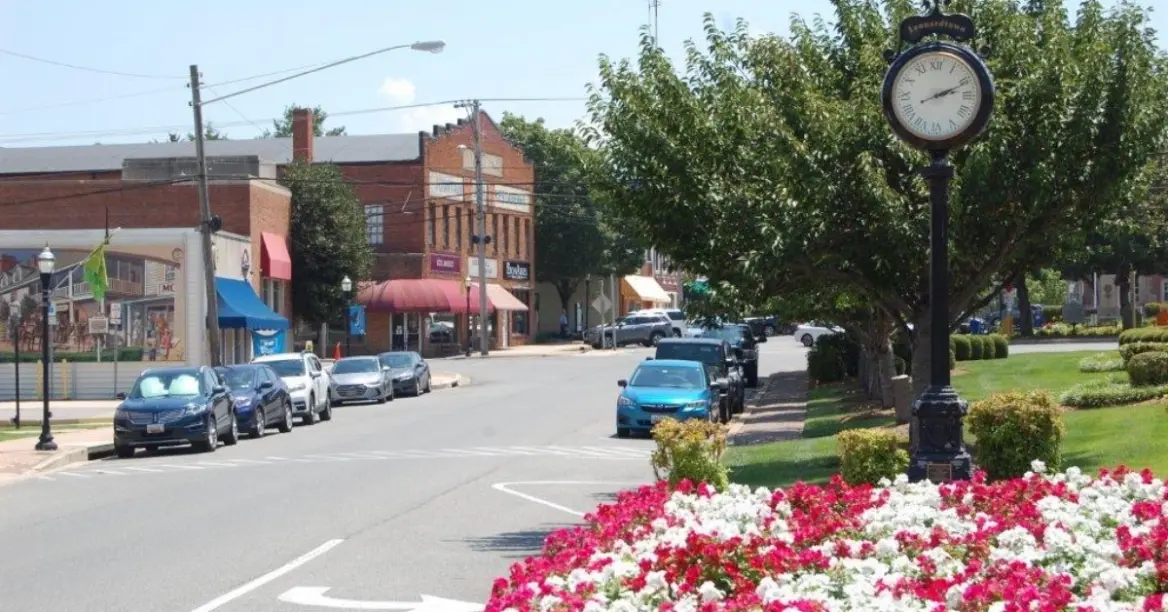
What does that mean?
For sellers, the competition is building faster than the number of closings. Pricing and presentation matter more when buyers have more time and more alternatives.
For buyers, there is more room to compare than there was a year ago. But a 4.7% change in the countywide median doesn’t mean a particular home, neighborhood or price range moved by the same amount.
For households relocating to NAS Patuxent River and the Lexington Park/California area, understanding how individual communities differ remains especially important.
Explore our guide to living in Lexington Park and California, MarylandCharles County: Higher Median Price, Longer Marketing Times
Oct. 2025 → Oct. 2026- Active inventory826from 732+12.8%
- Closed sales161from 194−17.0%
- Median sold price$450,000from $434,195+3.6%
- DOM48from 41+7 days
Charles County continues to have the largest number of available homes in Southern Maryland, with 826 active homes at the end of October—up 12.8% from 732 a year earlier.
It was also the only county where new listings declined, from 328 to 313, down 4.6%.
Closed sales fell from 194 to 161, a decline of 17.0%.
Unlike Calvert and St. Mary’s, Charles County’s median sold price increased.
The median sold price rose from $434,195 to $450,000—an increase of $15,805, or 3.6%.
But homes are taking longer to sell. DOM increased from 41 to 48 days, and CDOM increased from 59 to 64 days—the longest marketing times among the three counties.
Months of supply increased from 3.8 to 4.3 months, also the highest in the region.
| Metric | Oct. 2026 | Oct. 2025 | Change |
|---|---|---|---|
| New listings | 313 | 328 | −15 (−4.6%) |
| Active inventory | 826 | 732 | +94 (+12.8%) |
| Closed sales | 161 | 194 | −33 (−17.0%) |
| Median sold price | $450,000 | $434,195 | +$15,805 (+3.6%) |
| DOM | 48 | 41 | +7 days (+17.1%) |
| CDOM | 64 | 59 | +5 days (+8.5%) |
| Months of supply | 4.3 | 3.8 | +0.5 months |

What this means for Charles County sellers
A higher median sold price is encouraging, but it sits alongside more inventory, fewer sales and longer marketing times.
The relevant question isn’t simply:
“What did homes sell for last month?”
It’s also:
“How long are comparable homes sitting—and what can a buyer choose instead of mine?”
What this means for Charles County buyers
Longer marketing times and the region’s highest months of supply can give buyers more time to evaluate options.
At the same time, the rising median is a reminder that more inventory hasn’t translated into lower prices across the county. The right property, priced well, can still move.
One Region. Three Different Price Stories.
Inventory rose and sales fell everywhere in October. What happened to prices and marketing time depended on the county.
Calvert County
The largest increase in inventory (+41.4%). The median sold price was 13.7% lower than an unusually high October 2025, while homes that sold did so slightly faster.
St. Mary’s County
The largest decline in closed sales (−25.9%) and the largest rise in months of supply, from 2.2 to 3.6. The median sold price eased 4.7%.
Charles County
The only county with a higher median sold price (+3.6%), alongside the longest marketing times and the most months of supply (4.3).
That’s why a single regional headline can’t tell you what’s happening with a specific home or home search.
What matters is your county, your price range, your property type and your competition.
The Bigger Shift: More Homes, Fewer Closings
Two trends connected all three counties in October.
Inventory was higher than a year ago—and closed sales were lower.
| Active inventory | Oct. 2025 | Oct. 2026 | Change |
|---|---|---|---|
| Calvert County | 290 | 410 | +41.4% |
| St. Mary’s County | 284 | 335 | +18.0% |
| Charles County | 732 | 826 | +12.8% |
| Southern Maryland | 1,306 | 1,571 | +20.3% |
| Closed sales | Oct. 2025 | Oct. 2026 | Change |
|---|---|---|---|
| Calvert County | 108 | 86 | −20.4% |
| St. Mary’s County | 135 | 100 | −25.9% |
| Charles County | 194 | 161 | −17.0% |
| Southern Maryland | 437 | 347 | −20.6% |
Regionally, months of supply increased from 3.2 to 4.0, and homes that sold spent a little longer on the market: DOM rose from 40 to 43 days and CDOM from 52 to 54 days.
More inventory changes the conversation between buyers and sellers. Buyers can compare. They can evaluate condition. They can notice when a property is priced ahead of the market.
But more inventory on its own doesn’t define a buyer’s market. With the regional median sold price essentially unchanged and months of supply still at a moderate 4.0, October looks more balanced than it did a year ago—not one-sided.
For sellers, that means strategy matters more—not less. For buyers, it means more choice, not guaranteed discounts.
What the October Numbers Mean for Buyers
With 1,571 active homes across the region—265 more than last October—buyers generally have more choices and more time to compare Southern Maryland homes for sale.
But more inventory isn’t the same as lower prices everywhere.
The regional median sold price was essentially unchanged, and in Charles County it increased. A lower county median, like Calvert’s, reflects the mix of homes that sold in a given month—it doesn’t mean every home in that county is worth less by the same percentage.
Conditions can also look very different by property type. If you’re searching for Southern Maryland waterfront homes, for example, the competition for a specific type of shoreline, water access or pier can look nothing like a countywide average.
And if you’re relocating to Southern Maryland, more inventory can make it easier to line up options—especially when your timeline is fixed.
The opportunity for buyers may be less about waiting for prices to fall and more about having room to choose carefully—and potentially more negotiating room on the right property.
What the October Numbers Mean for Sellers
October’s numbers reinforce something we’ve been seeing across the market:
Simply being listed isn’t the same as being positioned to sell.
With more competing homes and fewer closings, the first weeks on the market matter.
Pricing needs to reflect today’s competition—not the market from a year or two ago, and not a countywide median in either direction.
Presentation needs to give buyers a reason to choose your home over the alternatives.
And if the market responds differently than expected, the plan may need to change.
That doesn’t mean sellers should automatically reduce their price. It means the listing strategy should be built on what buyers are actually doing now.
Local Market Outlook: What We’re Watching
One month of data shows direction, not destiny. As we move through the late fall and into winter, these are the signals we’ll be watching across Southern Maryland:
Inventory versus closings. Inventory has now risen year over year in all three counties in both September and October. Whether closed sales recover, or inventory keeps building faster than homes sell, will shape negotiating conditions.
Months of supply. At 4.0 months regionally, supply is higher than a year ago but still moderate. Continued increases would give buyers more leverage; a leveling off would point to a steadier market.
Calvert County’s median. Because October 2025 was an unusually high comparison month, the next several months will say more about Calvert pricing than a single year-over-year number.
Marketing time in Charles County. DOM and CDOM were up year over year there for the second straight month. We’ll be watching whether that continues.
We’ll report each of these again in next month’s update.
About the Data
- Source
- Bright MLS Market Statistics Report (insights.brightmls.com)
- Scope
- Residential properties, all price ranges, countywide for Calvert, St. Mary’s and Charles Counties
- Comparison
- October 1–31, 2026, compared with October 1–31, 2025 (completed calendar months)
- Retrieved
- November 9, 2026
- Regional figures
- From a single Bright MLS report covering all three counties combined. The regional median sold price is not an average of the county medians.
- Labels
- DOM, CDOM and months of supply are shown as reported by Bright MLS. Active inventory is end-of-month inventory.
Statistics may be revised as additional transactions are reported to Bright MLS after the end of the month.
Frequently Asked Questions
Is Southern Maryland a buyer’s market right now?
Not definitively. In October 2026, active inventory across Calvert, St. Mary’s and Charles Counties was up 20.3% from a year earlier and months of supply rose from 3.2 to 4.0. But the regional median sold price was essentially unchanged at $449,900, compared with $450,000. Conditions are more balanced than a year ago, and they vary by county, price range and property type.
Did home values in Calvert County drop 13.7%?
Not necessarily. Calvert County’s median sold price was $450,000 in October 2026, compared with $521,500 in October 2025. A median reflects the mix of homes that sold that month, and the October 2025 figure was unusually high. It shouldn’t be read as every Calvert County home losing the same percentage of value.
Which Southern Maryland county has the most homes for sale?
Charles County, with 826 active homes at the end of October 2026, compared with 410 in Calvert County and 335 in St. Mary’s County.
Were homes taking longer to sell in October?
It depended on the county. DOM fell from 39 to 35 days in Calvert County, rose from 38 to 40 days in St. Mary’s County and rose from 41 to 48 days in Charles County. Regionally, DOM increased from 40 to 43 days and CDOM from 52 to 54 days.
Where do these numbers come from?
All figures come from Bright MLS Market Statistics Reports for residential properties, all price ranges, countywide, comparing October 1–31, 2026, with October 1–31, 2025. Reports were retrieved November 9, 2026, and statistics may be revised as additional transactions are reported.
More homes and fewer closings—but prices are holding regionally. In this market, the details of your county, your price range and your property matter more than the headline.
Market statistics are based on Bright MLS residential Market Statistics Reports for October 2025 and October 2026 for Calvert, St. Mary’s and Charles Counties, retrieved November 9, 2026, and may be revised as additional transactions are reported. Countywide statistics can include different property types, locations and price ranges and should not be interpreted as a valuation or prediction for an individual property.